LLM Observability
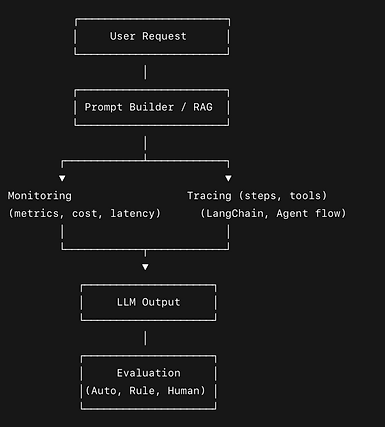
LLM observability is the practice of monitoring, tracing, and evaluating the behavior of large language models during inference and across system pipelines, to ensure:
-
Performance (latency, uptime)
-
Correctness (output quality, factuality)
-
Safety (toxicity, hallucinations)
-
Explainability (understanding how/why a response was generated)
Benefits
-
Faster debugging of bad generations
-
Trust & safety through toxic/harmful content detection
-
System optimization by analyzing latency, tool usage
-
Regulatory compliance via traceability and audit logs
-
Better user experience by tuning prompts or chains based on evals
LLM Observability
1
Monitoring
What to Monitor:
-
Latency & throughput: Time taken to generate a response.
-
Token usage: Input/output token counts and costs.
-
Model health: Timeouts, failures, token rate limits.
-
User behavior: Query patterns, retry loops, dissatisfaction signals.
-
Abuse detection: Prompt injections, jailbreak attempts.
Tooling & Implementation:
-
Set up dashboards (e.g., in Grafana, Datadog) for latency, cost, usage metrics.
-
Log inputs/outputs, token counts, and rate-limit errors.
-
Integrate with APIs from OpenAI, Anthropic, or open-source models (e.g., LangChain, LlamaIndex).
2
Tracing
What to Monitor:
-
Latency & throughput: Time taken to generate a response.
-
Token usage: Input/output token counts and costs.
-
Model health: Timeouts, failures, token rate limits.
-
User behavior: Query patterns, retry loops, dissatisfaction signals.
-
Abuse detection: Prompt injections, jailbreak attempts.
Tooling & Implementation:
-
Set up dashboards (e.g., in Grafana, Datadog) for latency, cost, usage metrics.
-
Log inputs/outputs, token counts, and rate-limit errors.
-
Integrate with APIs from OpenAI, Anthropic, or open-source models (e.g., LangChain, LlamaIndex).
3
Evaluations (Evals)
What to Monitor:
-
Latency & throughput: Time taken to generate a response.
-
Token usage: Input/output token counts and costs.
-
Model health: Timeouts, failures, token rate limits.
-
User behavior: Query patterns, retry loops, dissatisfaction signals.
-
Abuse detection: Prompt injections, jailbreak attempts.
Tooling & Implementation:
-
Set up dashboards (e.g., in Grafana, Datadog) for latency, cost, usage metrics.
-
Log inputs/outputs, token counts, and rate-limit errors.
-
Integrate with APIs from OpenAI, Anthropic, or open-source models (e.g., LangChain, LlamaIndex).
Get in Touch
Together, let's foster innovation & Success.